

D300 Software 사용 방법
- infoRAD
- 2017년 2월 12일
- 2분 분량
이미 많은 사용자 분들이 질량 유량 측정기(Mass Flow Meter / Controller) 를 컴퓨터와 연결해
데이터를 확인할 수 있다는 것을 알고 계실 것입니다.
Teledyne Hastings 에서도 Digital Mass Flow 제품들을 위한 소프트웨어를 제공하고 있는데,
D-300 시리즈의 소프트웨어에 실행방법에 대해서 알아보도록 하겠습니다.
연결

1. 소프트웨어를 실행시킵니다.
300B - Software - RS232 - Teledyne_digital_300A

2. 포트 연결을 합니다.
메뉴바에서 Connection - Open - Com(포트 번호) - Ok

연결이 되면 화면이 바뀌면서 유량과 Set Point 값이 화면에 나타나게 됩니다.
View 메뉴

View 메뉴에서는 데이터 및 조절에 대한 대부분의 작동을 설정할 수 있습니다.
1. Graph
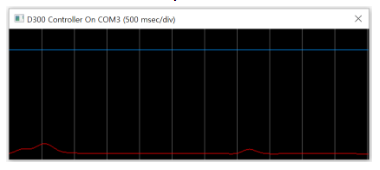
그래프를 선택하면 유량값을 실시간으로 Graph로 표시합니다.
2. Set Poin

Set Point 를 선택하면 위와 같은 화면이 나타납니다.
Full Scale 값을 % 단위로 환산하여 벨브를 컨트롤 할수 있으며 오른쪽의 숫자를 클릭하거나,
왼쪽의 바를 상하로 움직여 유량을 조절합니다.
3. PID Adjust

PID Adjust 를 선택하면 위와 같은 화면이 나타납니다.
Proportional, Integral, Derivative, Cracking, 4개의 컨트롤 바가 있으며
각각을 조절하여 Mass Flow Controller 의 벨브 움직임(속도)를 조절합니다.
MFC 의 벨브 컨트롤러는 제조 과정에서 최적의 상태로 맞춰져 있기 때문에
임의로 조절하지 않도록 주의합니다.
PDI Control 에 대한 더 자세한 설명은 아래의 링크를 확인하시기 바랍니다.

4. Command Window

Command Window 를 선택하면 위와 같은 화면이 나타납니다.
CMD 창에 Serial Communication 명령어를 입력해 여러가지 명령을 바로 할 수 있습니다.
커맨드의 종류는 메뉴얼을 참고하시기 바랍니다.
5. Totalizer

Totalizer 를 선택하면 위와 같은 화면이 나타납니다.
Totalizer는 유량의 총 누적량을 표시해 주며, 아래의 reset 버튼을 누르면 누적량이 초기화됩니다.
6. Flow in % FS 와 Flow in Units

Flow in Units 과 Flow in % FS 버튼을 누르면 위와 같은 화면이 나옵니다.
Flow in % Fs 버튼을 누르면, Set Point 를 최대 유량 대비 % 단위로 유량이 표시되며,
Flow in Units 버튼은 Set Point 를 단위 값으로 표시합니다.
Logging 메뉴
1. 시작

Logging 이란 데이터를 로깅하여 컴퓨터에 입력하는 것을 말합니다.
Logging - Start log - 저장 위치 및 이름을 선택하면 Data Logging 이 시작됩니다.
2. 정지

Logging - Stop log - 저장위치의 .csv 파일을 설정하면 csv 파일이 생성되며 데이터가 입력됩니다.
추가 문의 사항은 아래의 링크를 이용해 주시기 바랍니다.

Comments